
Most water and wastewater utilities will tell you they “have SCADA.” Fewer can tell you what their system was doing at 2 a.m. last Tuesday — or whether a pump that ran fine this morning has been quietly working twice as hard as it should for the past three weeks.
That gap is the difference between data and visibility. A red light tells you something already failed. It doesn’t tell you it was about to fail. And the most expensive failures in this industry — a tank that drains overnight, a lift station that overflows during a storm, a pump that burns out months early — almost always leave a trail of warning signs first. The only question is whether your system shows them to you.
If your monitoring can’t surface the four things below, you’re not really watching your system. You’re flying blind and hoping the alarms catch what matters.
1. Tank Level Trends — Not Just the Current Number
A single level reading is a snapshot. The trend is the story.
Knowing a tank sits at 22 feet right now is useful. Knowing it has slowly dropped two feet every night this week — when demand should be flat — is what actually saves you. That slow, steady drift is the signature of a leak, a stuck altitude valve, an open hydrant, or unauthorized usage. None of those trip a high/low alarm. All of them show up immediately when you can scroll back through days or weeks of level history and see the shape of the curve.
Fill-and-draw cycles tell their own story, too. If your source can’t refill the tank fast enough to keep pace with peak demand, you’ll see it in the pattern — the tank stops recovering to its usual high point, and each cycle’s peak trends a little lower over time. You’ll spot that drift weeks before it turns into low-pressure complaints.
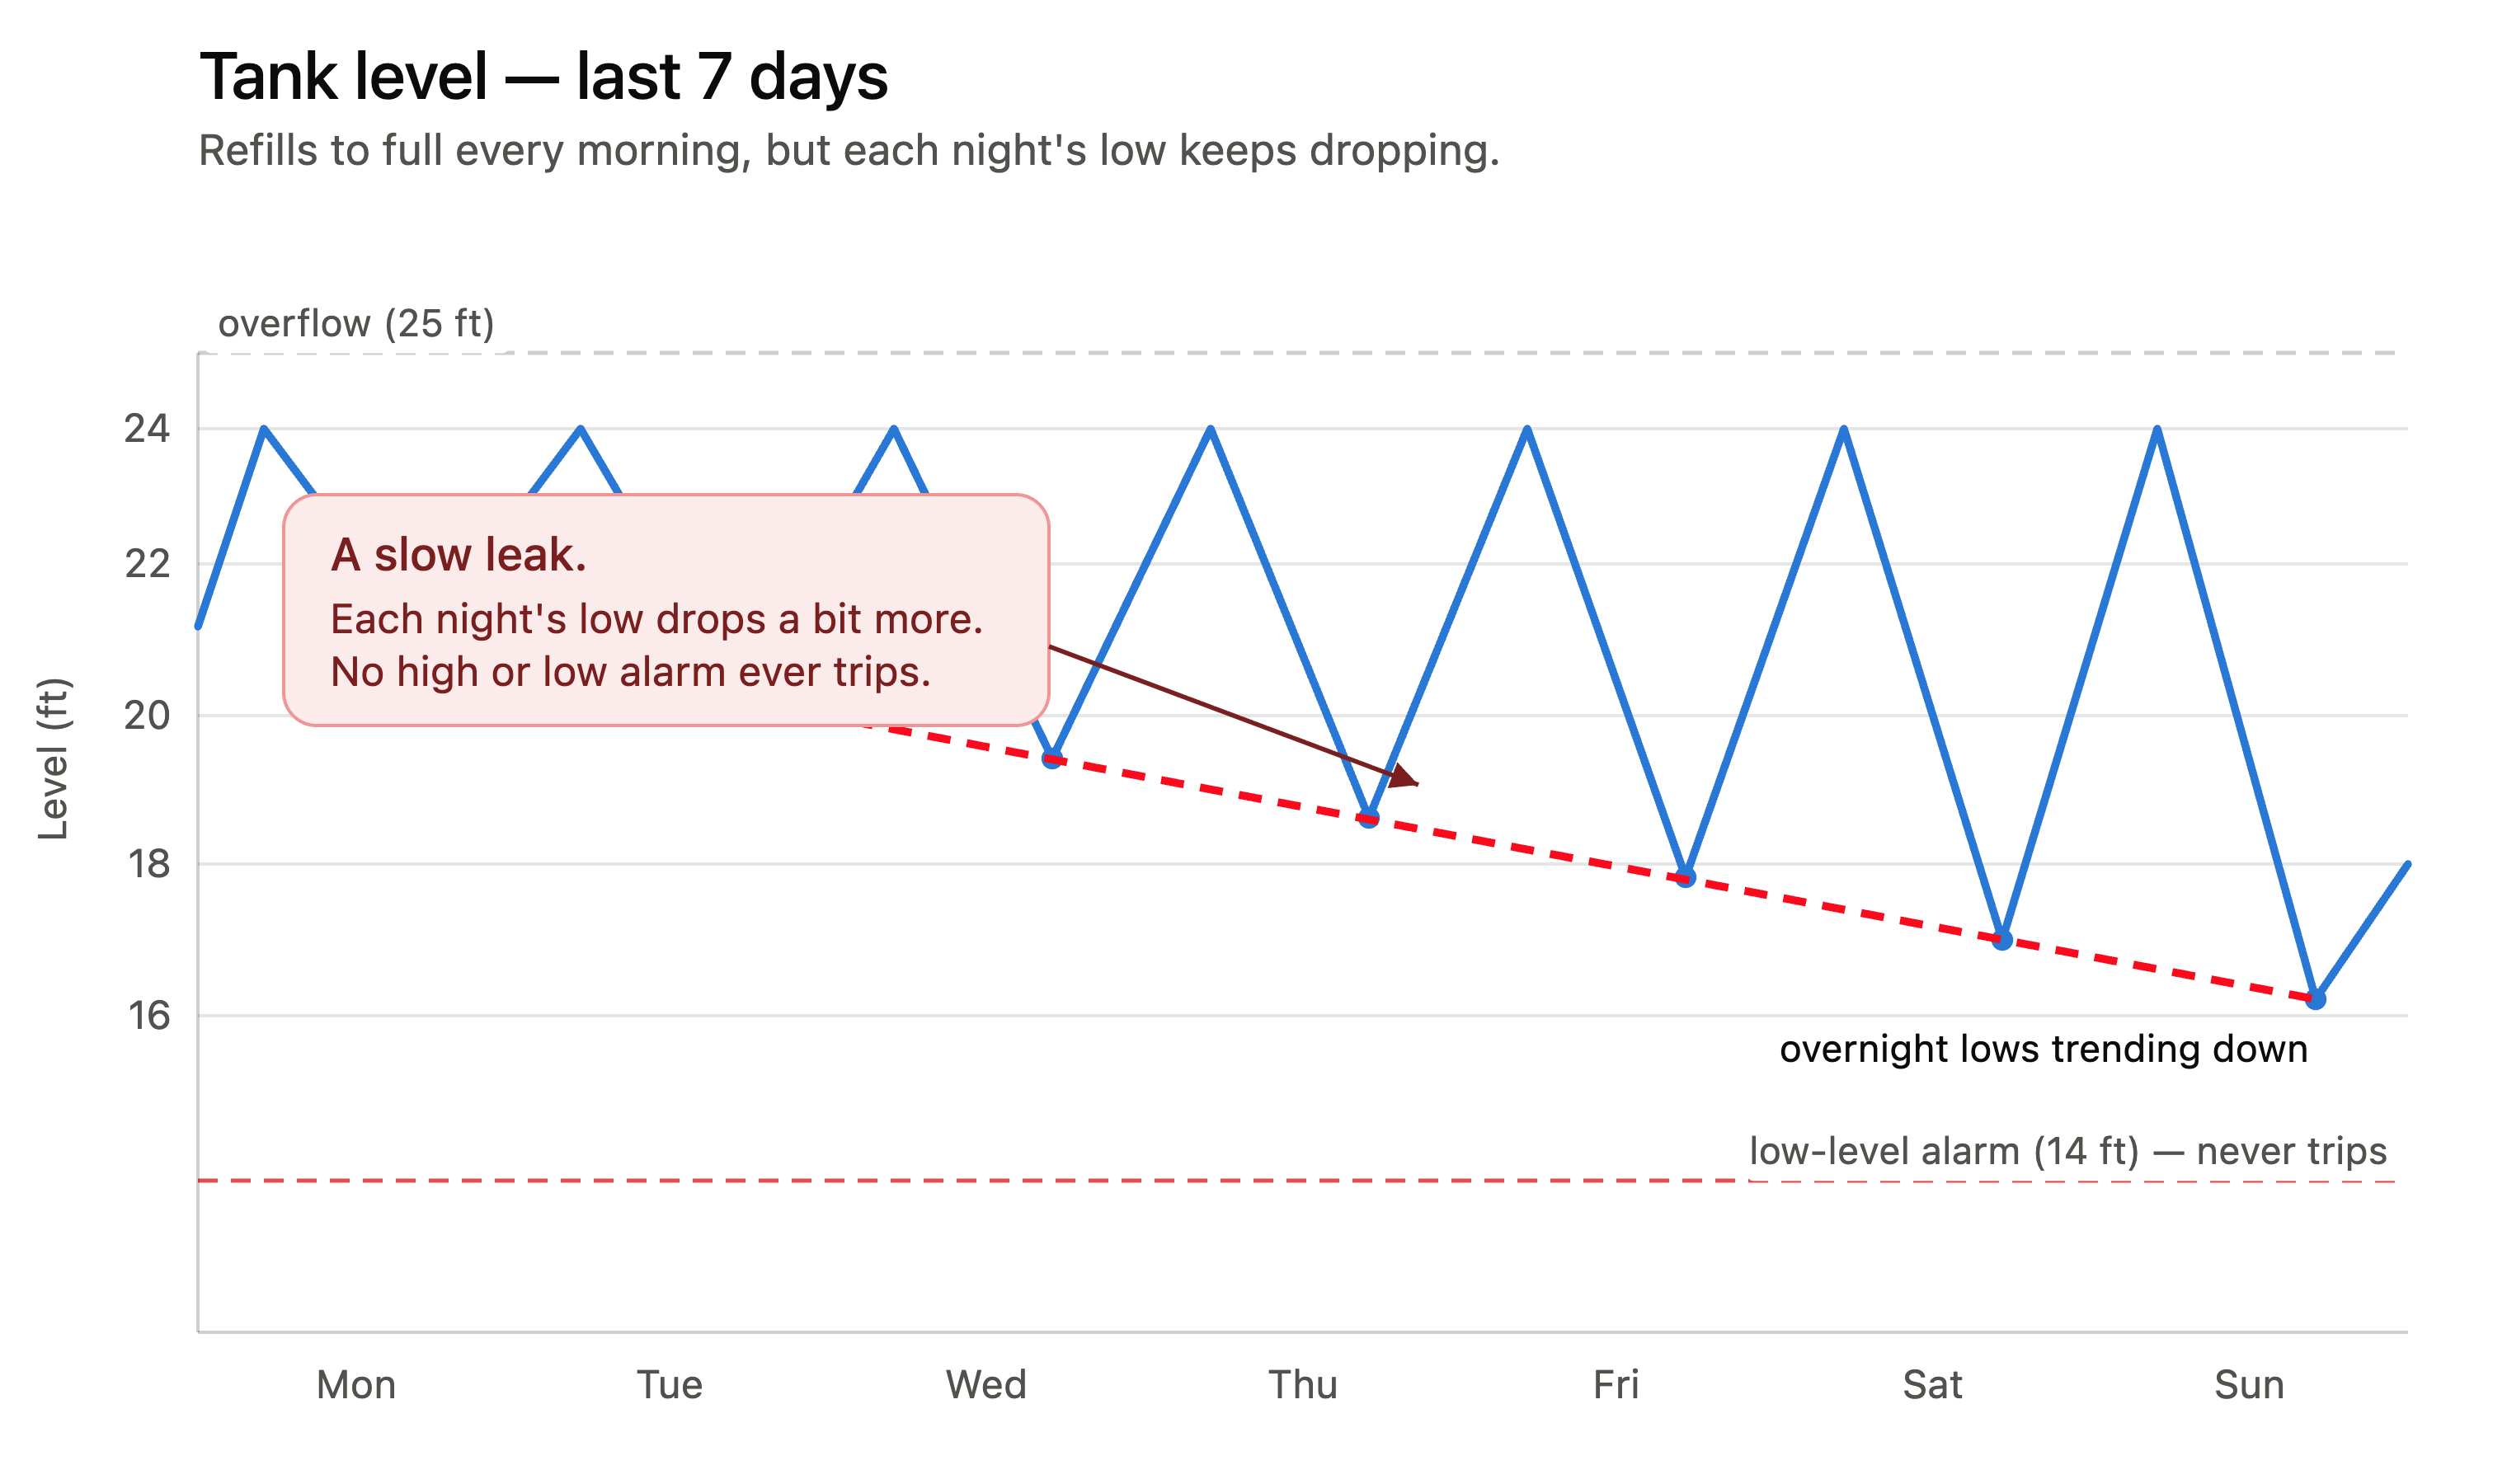
With a MyDro RTU feeding real-time level data into 123SCADA, you’re not staring at one number — you’re reading a moving picture of how your storage actually behaves.
2. Pump Runtimes — Not Just On/Off
“The pump is running” is the least useful thing your system can tell you. How long, how often, and compared to what is where the insight lives.
Runtime is your earliest and cheapest diagnostic tool:
- Uneven lead/lag wear. If your lead pump is logging far more hours than its partner, a float may be failing, the alternation may be broken, or the lag pump simply isn’t kicking in. You’re wearing out one pump on borrowed time.
- Climbing runtime for the same job. When a pump needs more minutes to move the same volume, you’re watching a clogging impeller, a worn pump, or rising inflow in your collection system — in real time, not at autopsy.
- Short-cycling. Frequent, brief starts hammer motors and spike energy costs. A runtime log makes that pattern obvious.
This matters most at the lift station, where the stakes are highest. The EPA lists inadequate pump maintenance and lack of backup power among the leading causes of sanitary sewer overflows. Runtime trends are how you catch a failing pump before it becomes a violation — and a planning tool for maintenance and energy budgeting at the same time.
3. Flow Anomalies — Catching the Unusual Before It’s a Headline
Flow that doesn’t match its normal pattern is the canary in the coal mine.
A surge in collection-system flow during dry weather points to infiltration, a cross-connection, or a blockage backing the system up. A spike that tracks rainfall is inflow and infiltration (I&I) pushing your system toward its ceiling. On the distribution side, an unexpected jump in demand can mean a main break long before anyone reports low pressure.
The numbers behind this are sobering. The EPA estimates there are tens of thousands of sanitary sewer overflows in the U.S. every year, and SSOs that reach waterways are prohibited without a permit. Many of them are preceded by flow patterns that a watchful system would have flagged.
The key is monitoring rate of change, not just fixed thresholds. 123SCADA can alarm on the behavior that’s abnormal for your site — the deviation from baseline — instead of waiting for an absolute number that only trips once you’re already in trouble.
4. Site & Communication Health — Knowing When You’ve Gone Dark
Here’s the blind spot nobody plans for: a site goes silent, and silence reads as “everything’s fine.”
If your entire safety net depends on receiving an alarm, then a dead radio, a failed cellular link, or a site power loss means no alarm arrives at all. The most dangerous failure is the one that takes out your ability to be warned about it.
A system worth trusting watches its own pulse. 123SCADA’s managed cellular communications and consistent site-health monitoring flag an RTU that stops reporting in, along with power-fail and low-battery conditions — so a quiet site triggers a question instead of false comfort.
Data vs. Visibility: What Your System Should Actually Tell You
| What a basic system shows | What you actually need to know |
|---|---|
| Tank is at 22 ft | Tank has lost 2 ft/night all week — possible leak |
| Pump is ON | Lead pump has 3× the runtime of its lag partner |
| Flow = 480 GPM | Dry-weather flow is up 40% — likely infiltration |
| (No alarm received) | Site went offline 6 hours ago — comms or power down |
| A snapshot | A trend, a pattern, and an early warning |
How Mission RTUs and 123SCADA Close the Gap
Mission Communications built 123SCADA around exactly this distinction. Mission RTUs report over managed cellular to a hosted platform — no servers to maintain, no software to patch — and every reading is logged so you can see trends, not just live status. Configurable alarms can watch thresholds and rates of change, and you can review tank curves, pump runtimes, and flow history from any browser or phone. And because that visibility is only as good as the system protecting it, 123SCADA secures your data end to end — multi-factor authentication, role-based access, and encryption baked in — so the people watching your system are the only ones who can.
Since 1999, Mission has grown that approach to more than 40,000 RTUs monitored for over 6,100 small utilities and municipalities — many of them rural systems running lean. The whole point is to give a small staff the visibility of a much larger operation.
If your current system can’t show you the four things above, it’s time for a system that can. Talk to the Mission team about what real visibility looks like for your utility — and stop flying blind.